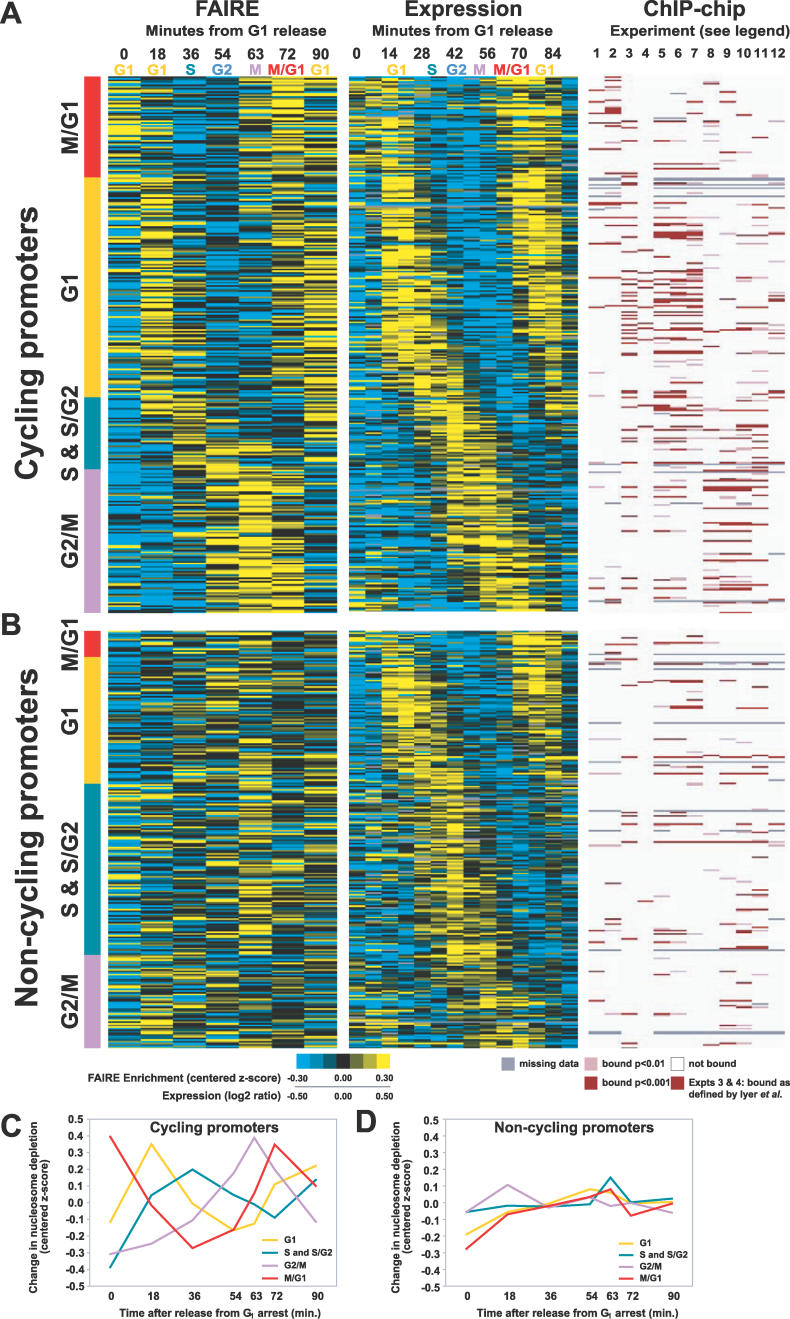
Figure 7. Classification of Cell Cycle–Regulated Promoters.
For panels (A) and (B), the approximate cell cycle stage corresponding to each time point in the FAIRE and expression [30] time course is listed along the top. ChIP-chip experiments are numbered 1 through 12 as follows (1) Ace2, (2) Swi5, (3) SBF, (4) MBF, (5) Swi4, (6) Swi6, (7) Mbp1, (8) Mcm1, (9) Ndd1, (10) Fkh2, (11) Fkh1, and (12) Stb1. For experiments 3 and 4 [42], a red bar indicates binding as defined by the authors. For experiments 1, 2, and 5–12 [40], a dark bar indicates binding at p < 0.001, a lighter bar indicates binding at p < 0.01. White indicates a lack of binding, and missing data are indicated by gray. Each cell cycle promoter was classified into the “cycling” or “non-cycling” group based on visual inspection of its nucleosome occupancy profile. All loci in this figure and their classifications can be found in Table S1.
(A) Promoters with FAIRE signals that fluctuated with the cell cycle (proportion cycling: G1, 63%; S & S/G2, 30%; G2/M, 61%; and M/G1, 79%). For the FAIRE experiments, yellow indicates enrichment, blue depletion. For expression, yellow indicates high relative expression, blue low.
(B) Promoters with FAIRE signals that did not fluctuate with the cell cycle. (C) The average chromatin profiles derived from FAIRE data for cycling promoters and (D) non-cycling promoters.

