
Figure 1.
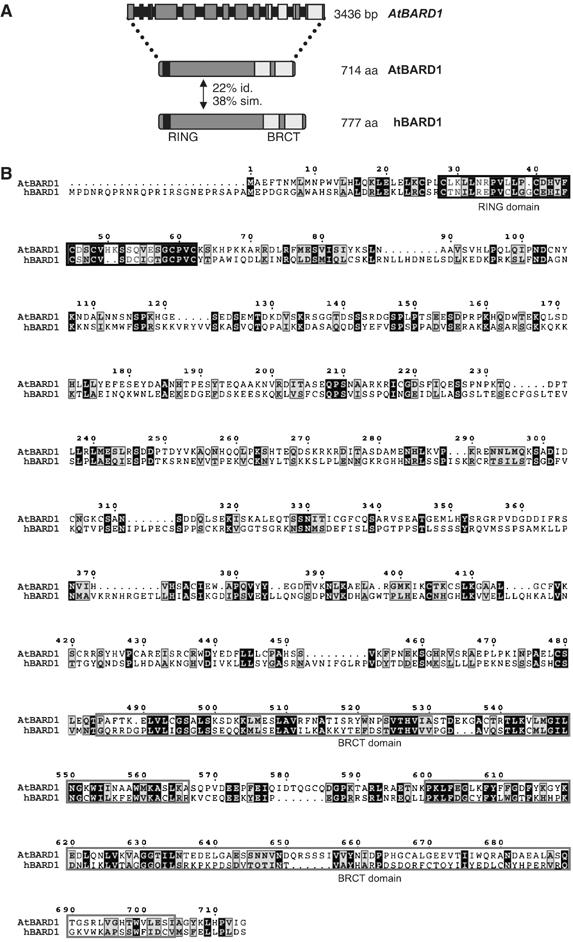
Gene structure of AtBARD1 and comparison of the AtBARD1 and hBARD1 proteins. (A) A schematic representation of the AtBARD1 intron–exon structure. Exons are represented by grey boxes, introns by black bars. In total, the AtBARD1 gene counts 13 exons, the gene has a length of 3436 bp encoding a protein of 714 aa. The AtBARD1 protein has a similar structure as the hBARD1 protein, also containing a conserved RING domain (black regions) and two BRCT domains (light grey regions). Both proteins have an identity of 22% and a similarity of 38%. (B) Protein sequence alignment of AtBARD1 against hBARD1. Identical amino acids are shaded black whereas similar amino acids are shown in grey. Conserved RING and BRCT domain structures are indicated by black and light grey frames, respectively.