
Figure 2.
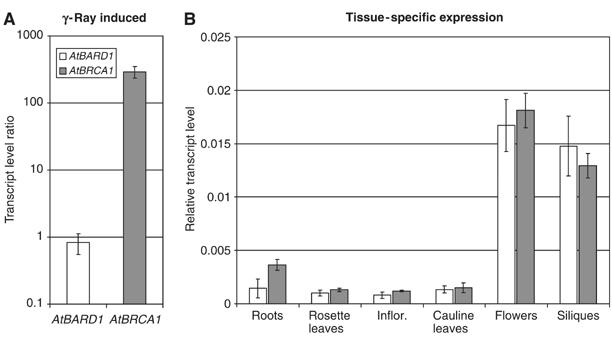
Expression analysis of AtBARD1 and AtBRCA1 in Arabidopsis. (A) The expression of AtBARD1 and AtBRCA1 was analysed by relative quantification using real-time PCR 1 h after irradiation by γ-ray. Transcription level ratio of AtBARD1 and AtBRCA1 is given in relation to actin mRNA and the mRNA of the respective untreated seedlings, and is the mean of six different reactions ±s.d. White bars, AtBARD1; grey bars, AtBRCA1. (B) The expression pattern of AtBARD1 and AtBRCA1 in different plant tissues was analysed by relative quantification using real-time PCR. RNA from roots, rosette leaves, inflorescence, cauline leaves, flowers and siliques of soil-grown plants was analysed. Expression of AtBARD1/AtBRCA1 is given relative to actin mRNA levels and is the mean of six different reactions±s.d. Similar results were obtained in independent experiments.