
Figure 6.
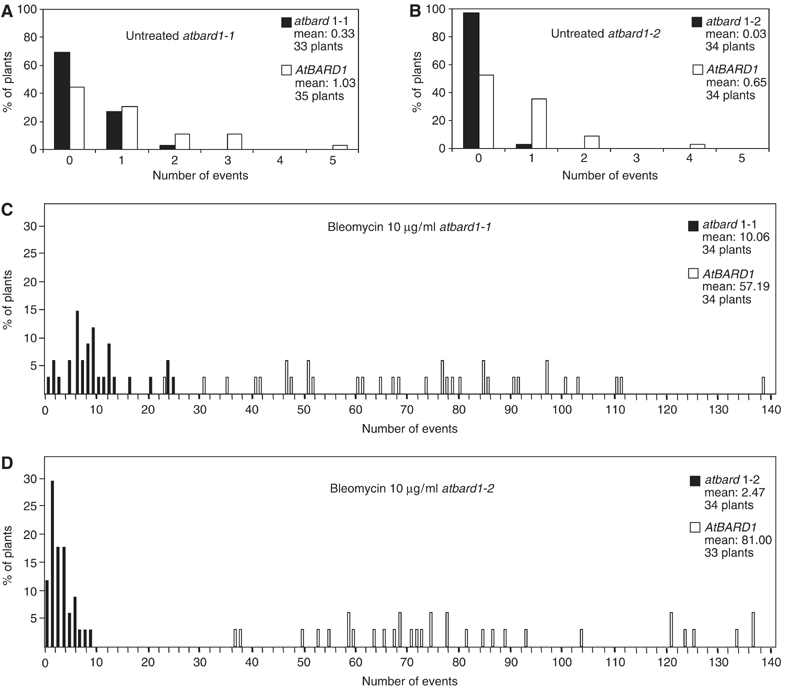
HR events in 651/atbard1 seedlings. The diagrams show the percentage of seedlings with a given number of blue spots. (A) Untreated atbard1-1, (B) untreated atbard1-2, (C) bleomycin-treated atbard1-1 and (D) bleomycin-treated atbard1-2. atbard1 seedlings are displayed as black bars, segregated control plants homozygous for AtBARD1 are shown as white bars.