
Figure 2.
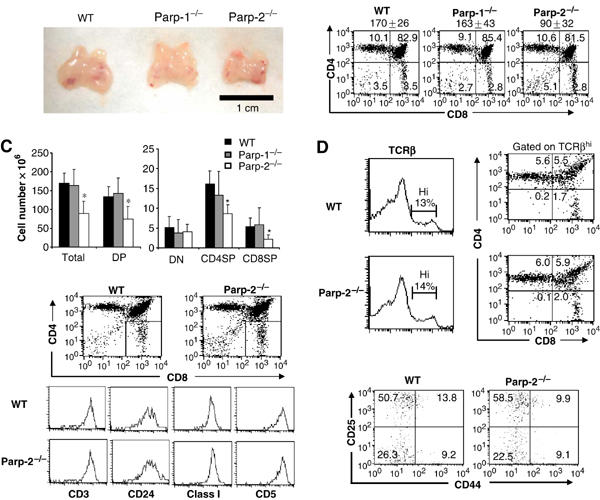
T-cell development. (A) Macroscopic comparison of control (WT), Parp-1−/− and Parp-2−/− thymuses. (B) Single cell suspensions of thymocytes from 6-week-old WT, Parp-1−/− and Parp-2−/− mice were counted, stained with PE-anti-CD4 and FITC-anti-CD8 mAbs and analyzed by flow cytometry. The mean±s.d. of total number of thymocytes in WT (n=45), Parp-1−/− (n=9) and Parp-2−/− (n=45) mice is indicated in the top of each graph. Representative dot plots are shown. Percentage of cells in the individual subpopulations is indicated in each quadrant. (C) Absolute number of thymocyte populations. The number of thymocytes in each population was calculated by multiplying the percentage of each population by the total number of thymocytes. Values represent the mean±s.d. (D) Representative analysis of thymic TCRβ expression in age-matched Parp-2−/− and WT littermates. Thymocytes with high expression of TCRβ were gated and further analyzed for the expression of CD4 and CD8. (E) ISP cells analysis in Parp-2−/− and WT mice. CD8SP thymocytes were gated and analyzed for the expression of CD3, CD24, CD5 and MHC class I. (F) DN thymocytes analysis in Parp-2−/− and WT mice. Thymocytes were stained with mAbs against CD4, CD8, CD25, CD44 and lineage markers (CD3, Gr-1, B220 and CD11b). Thymocytes negative for CD4, CD8 and lineage markers were gated and analyzed for CD25 and CD44 expression. Representative dot plots are shown. The percentage of cells in each quadrant represents the mean from at least six mice in each group. *Statistically significant difference (P<0.05).