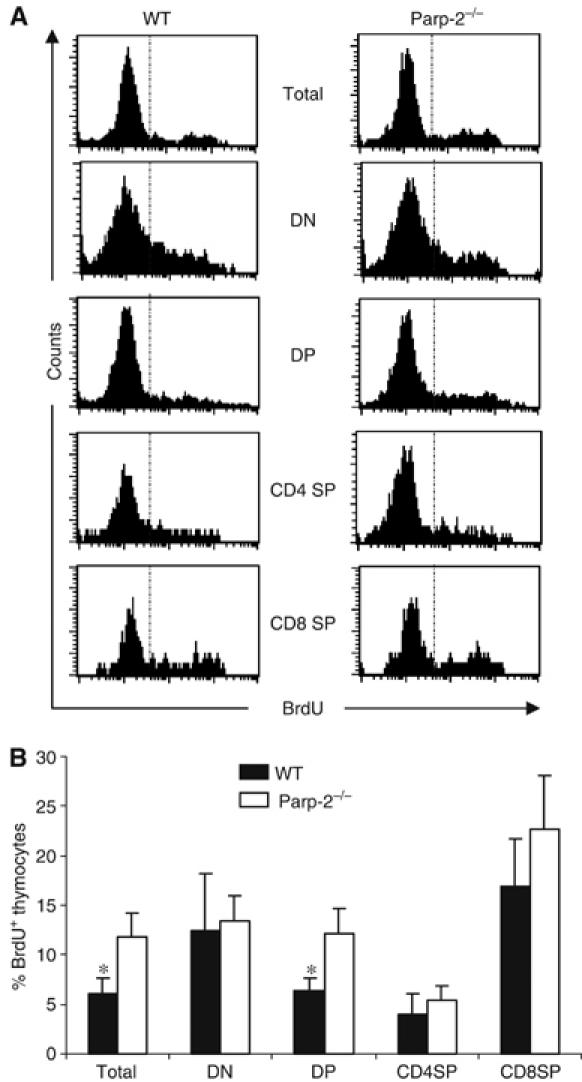
Figure 3.

Thymocyte proliferation in control (WT) and Parp-2−/− mice. Six-week-old mice were i.p. injected with BrdU (1.5 mg/mouse) and thymocytes were analyzed by flow cytometry, 5 h after injection, for CD4 and CD8 expression and for the incorporation of BrdU. (A) Representative histograms are shown. (B) Percentage of BrdU+ cells in total, DN, DP, CD4SP and CD8SP thymocytes. Results shown represent the mean±s.d. values obtained from two independent experiments including WT (n=5 per experiment) and Parp-2−/− (n=6 per experiment) mice. *Statistically significant difference (P<0.05).
