
Figure 3.
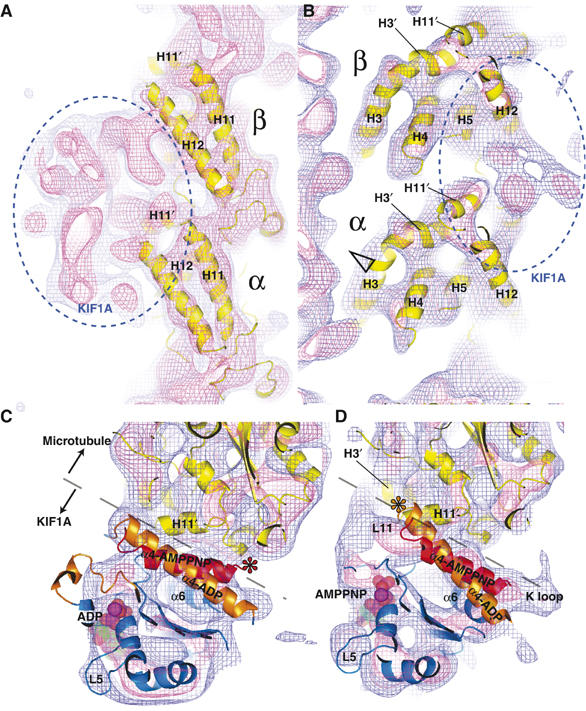
Detailed views of the 3D reconstructions of the KIF1A–MT complex. (A) Right and (B) left sides of the MT protofilament outer surface in the AMPPNP complex showing the similarity between the tubulin atomic model and map. Blue and pink chickenwires represent 0.7σ and 1.5σ of the density map, respectively. Solvent-exposed helices (H3–5, H11 and H12) are well resolved. A small shift of α-tubulin helix H3 is indicated with an open arrowhead, possibly as a result of interactions with loop L11 of KIF1A. (C, D) Top view of the switch II helix from the plus-end of the MT (C) in the ADP and (D) AMPPNP states. Both ADP (orange) and AMPPNP (red) KIF1A switch II helices are fitted into the complexes. The interface between KIF1A and MT is depicted with dashed lines. Asterisks indicate the possible points of steric clashes between KIF1A and tubulin atomic models.