
Figure 1.
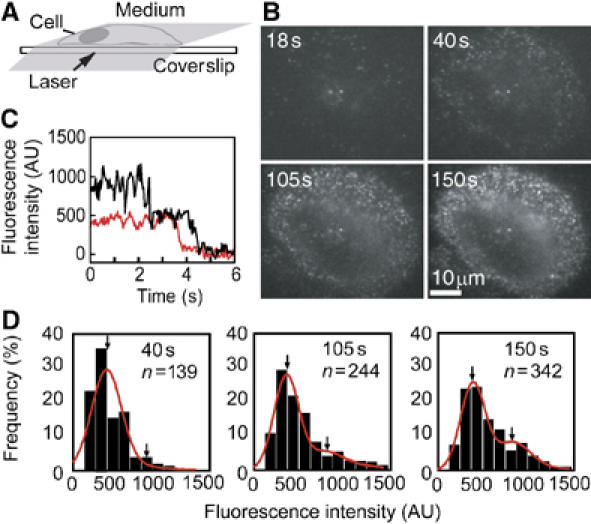
Single-molecule visualization of Rh-EGF bound on the living cell surface. (A) Oblique illumination with a thin laser beam through the objective lens of a microscope allows single-molecule visualization on the apical cell surface. (B) Once the apical surface near the edge of a cell was brought into focus, Rh-EGF was added to the extracellular medium. Pictures taken 18, 40, 105 and 150 s after the addition of Rh-EGF (0.5 nM final concentration) are shown. (C) A typical fluorescent spot on the cell was photobleached in a single step (red) or double steps (black), indicating that the spot contained a single molecule or two molecules of Rh-EGF, respectively. (D) Distribution of the fluorescence intensity of Rh-EGF spots bound on the cell shown in (B) analyzed 40, 105 and 150 s after the addition of Rh-EGF. The distributions were fitted to a sum of two Gaussian functions (red line). Arrows indicate the mean of the fractions containing one and two Rh-EGF molecules. n: total number of spots; AU: arbitrary unit.