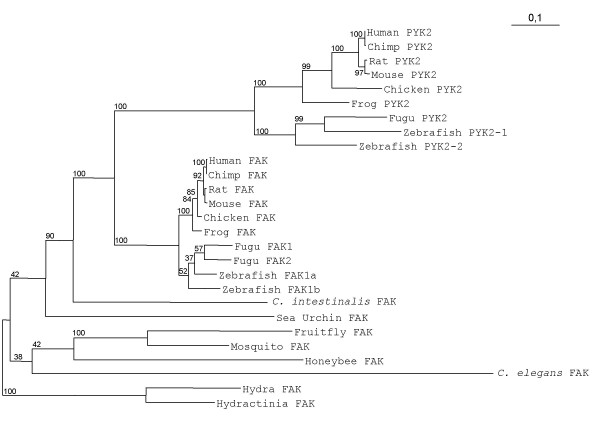
Figure 1.

Phylogenetic analysis of FAK and PYK2. Blocks of conserved positions distributed across the full length FAK sequences from 16 species were used in a maximum likelihood analysis. The putative FAK sequences from cnidarians (hydra and hydractinia) were set as the outgroup. The branch lengths of the tree are proportional to differences between species. Numbers beside branch points indicate the confidence level for the relationship of the paired sequences as determined by bootstrap statistical analysis (100 replicates). See text for a discussion of FAK duplication in fugu and zebrafish.
