
Figure 5.
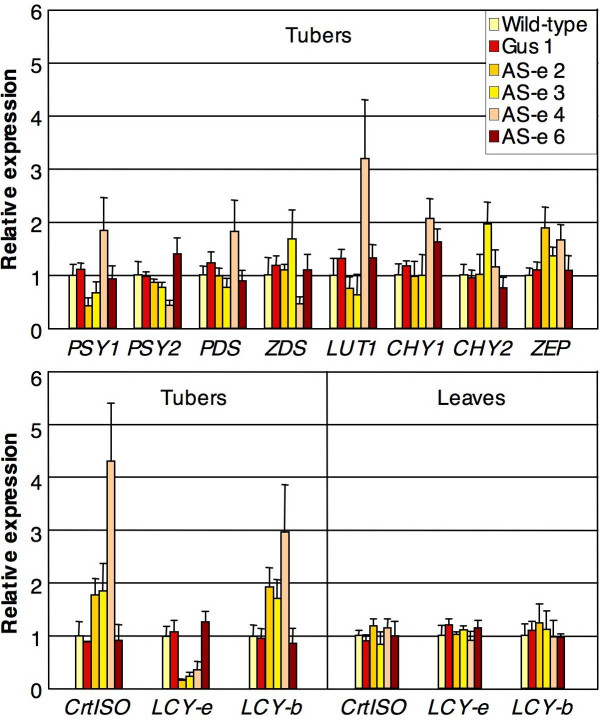
Endogenous carotenoid gene expression. Transcript levels were measured through Real Time RT-PCR and were first normalized for expression of the housekeeping β-tubulin gene, and then for the expression levels in the Wt. Data show the average and SE (error bars) of determinations from at least 4 different tubers (or leaves) from 2 different plants. For details see Methods.