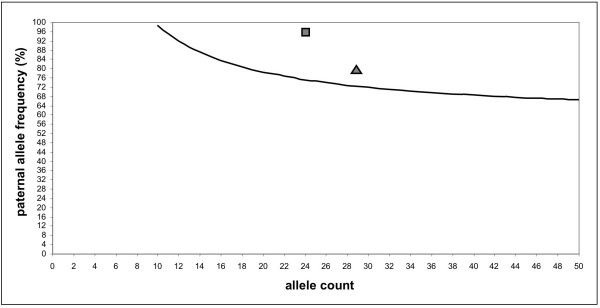
Figure 4.
Graphic representation of SPRT. The curve shows the boundary for a threshold likelihood ratio of 8 and for a given number of analyzed alleles. Points above this curve are interpreted as detection of statistically significant loss of the maternal allele. The square represents the 23/24 data point while the triangle localizes the 23/29 value.

