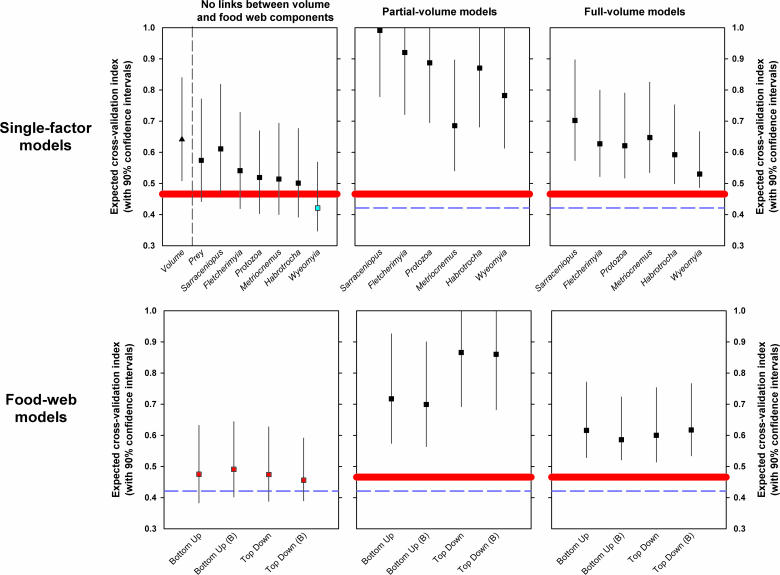
Figure 2. Cross-Validation Indices and 90% Confidence Intervals for Path Analysis Models of Macroinvertebrate Abundance.
The smaller the index, the better is the fit of the data to the predictions of the model. The upper row of panels includes all single-factor models (Tables S3 to S6). The single-factor model that has only habitat volume as a predictor variable (see Table S3) is indicated by a triangle to the left of the dashed vertical line. The lower row of panels includes all food-web models (Tables S7 to S9). Food-web models designated with a (B) include a latent variable to represent bacteria. The first column of panels includes models with no links to habitat volume (Tables S3, S4, and S7). The second column of panels includes models with limited links to habitat volume (Tables S5 and S8). For the bottom-up food-web models, the link was from habitat volume to prey abundance, and for the top-down food-web models, the link was from habitat volume to the abundances of Fletcherimyia and Wyeomyia. The third column of panels depicts models with all taxa linked to habitat volume (Tables S6 and S9). The single best-fitting model (Wyeomyia keystone with neither partial nor complete links with habitat volume) is indicated with a blue symbol. The group of best-fitting models (food-web models with no volume links) is indicated with red symbols. For reference in each panel, the cross-validation index for the Wyeomyia model is indicated by a dashed blue line, and the average cross-validation for the food-web models with no habitat links is indicated by a solid red band.

