
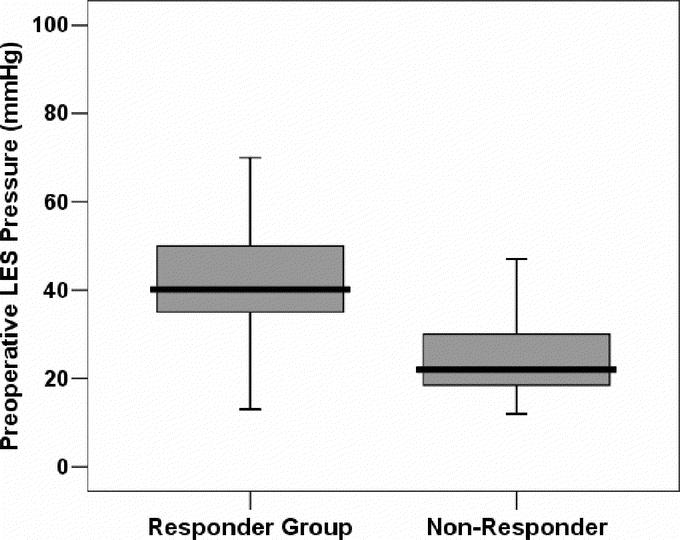
FIGURE 3. Preoperative LES pressure in the 2 groups. Data are shown as median (horizontal line), interquartile range (box), and 5th to 95th percentile (vertical line).
Official websites use .gov
A
.gov website belongs to an official
government organization in the United States.
Secure .gov websites use HTTPS
A lock (
) or https:// means you've safely
connected to the .gov website. Share sensitive
information only on official, secure websites.
FIGURE 3. Preoperative LES pressure in the 2 groups. Data are shown as median (horizontal line), interquartile range (box), and 5th to 95th percentile (vertical line).