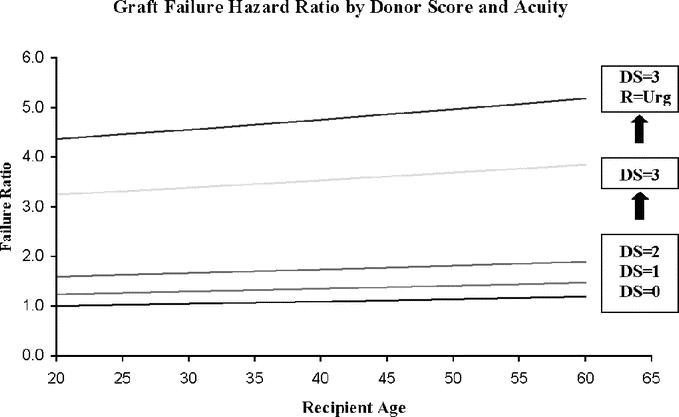
FIGURE 2. Graft failure risk based on donor score and recipient acuity. The risk of graft loss at 1 year as a function of recipient age is shown for allografts with Donor Scores (DS) of 0, 1, 2, and 3. The lower curves represent nonurgent recipients. The uppermost curve represents the graft failure hazard ratio in urgent recipients who are transplanted with allografts with a DS of 3.
