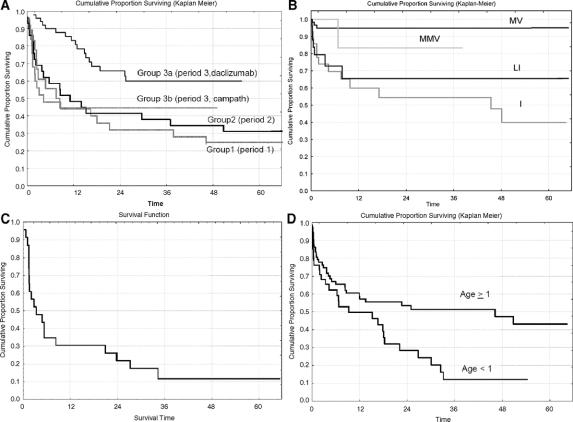
FIGURE 3. A, Kaplan-Meier patient survival by group: group 1 (n = 25, 20 deaths), group 2 (n = 29, 20 deaths), group 3a (n = 51, 17 deaths), and group 3b (n = 18, 10 deaths) (P = 0.002 comparing the 4 groups, and P = 0.0003 comparing group 3a vs. the other 3 groups combined). Note: The x-axis label “Time” refers to “time (in months) following transplantation” (same for B and D). B, Kaplan-Meier freedom-from-the development of a severe rejection episode by type of transplant: MV (n = 61, 3 failures), MMV (n = 7, 1 failure), c-LI (n = 27, 7 failures), and I (n = 28, 13 failures) (P = 0.0001 comparing the 4 groups, and P = 0.00001 comparing I and c-LI combined vs. MV and MMV combined). C, Kaplan-Meier patient survival following the development of a severe rejection (n = 24, 20 deaths). Note: The x-axis label “Time” refers to “time (in months) following severe rejection.” D, Kaplan-Meier freedom from the development of a respiratory infection by age at transplant: age ≥1 year (n = 75, 35 failures), and age <1 year (n = 48, 31 failures) (P = 0.02).

An official website of the United States government
Here's how you know
Official websites use .gov
A
.gov website belongs to an official
government organization in the United States.
Secure .gov websites use HTTPS
A lock (
) or https:// means you've safely
connected to the .gov website. Share sensitive
information only on official, secure websites.
