
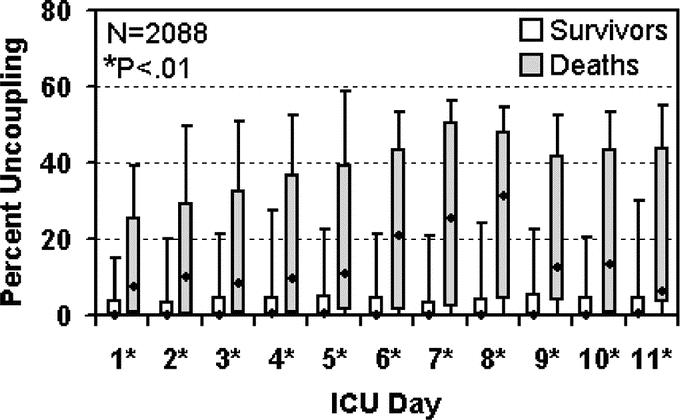
FIGURE 2. Cardiac uncoupling over time by mortality. Percent cardiac uncoupling is shown for survivors and nonsurvivors at each ICU day as follows: T-bars denote 10th (lower) and 90th (upper) percentiles, boxes denote 25th (lower), and 75th (upper) percentiles, and dots show the median percent uncoupling within each group. Differences in cardiac uncoupling between survivors and nonsurvivors were assessed using the Wilcoxon rank sum test. Statistically significant differences in daily percent cardiac uncoupling between survivors and nonsurvivors were evident through ICU day 11. While the total population comprises 2088 distinct cases, at each ICU day the number of cases with available data is less due to patients being transferred to/from the ICU (Table 2 for number of cases at each day).