
Figure 10.
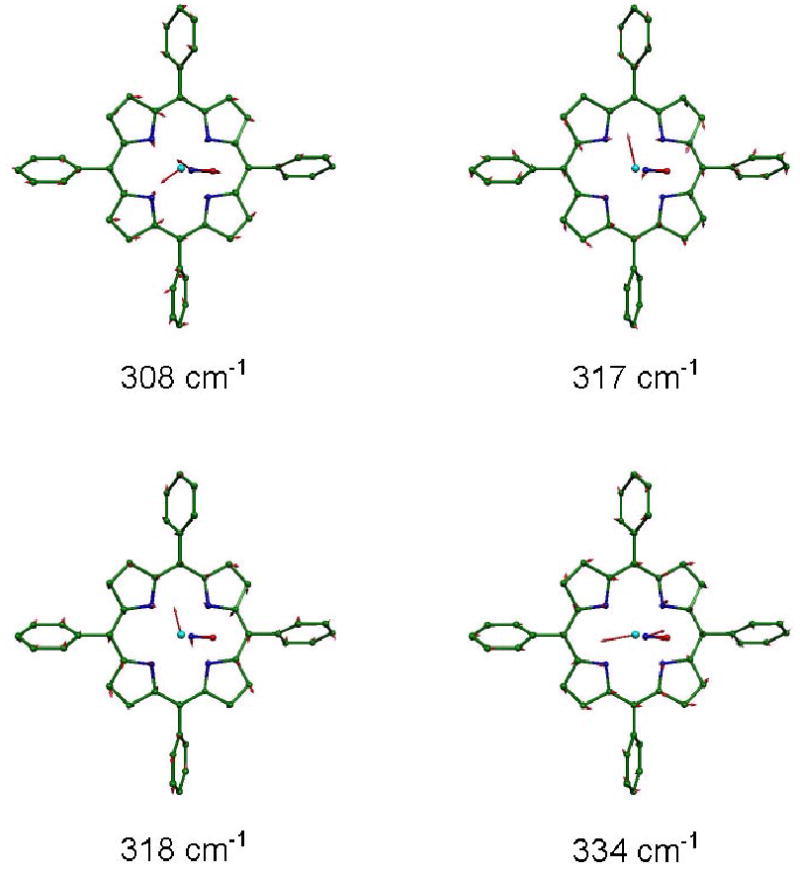
Four in-plane Fe modes, predicted on the basis of B3LYP calculations, contributing to the pair of experimental features at 312 cm−1 and 333 cm−1 in the Fe(TPP)(NO). Arrows represent the mass-weighted displacements of the individual atoms. For ease of visualization, each arrow is 100(mj/mFe)1/2 times longer than the zero point vibrational amplitude of atom j. Color scheme: cyan–iron, green–carbon, blue–nitrogen, red–oxygen. In this and other figures, hydrogens are omitted for clarity.