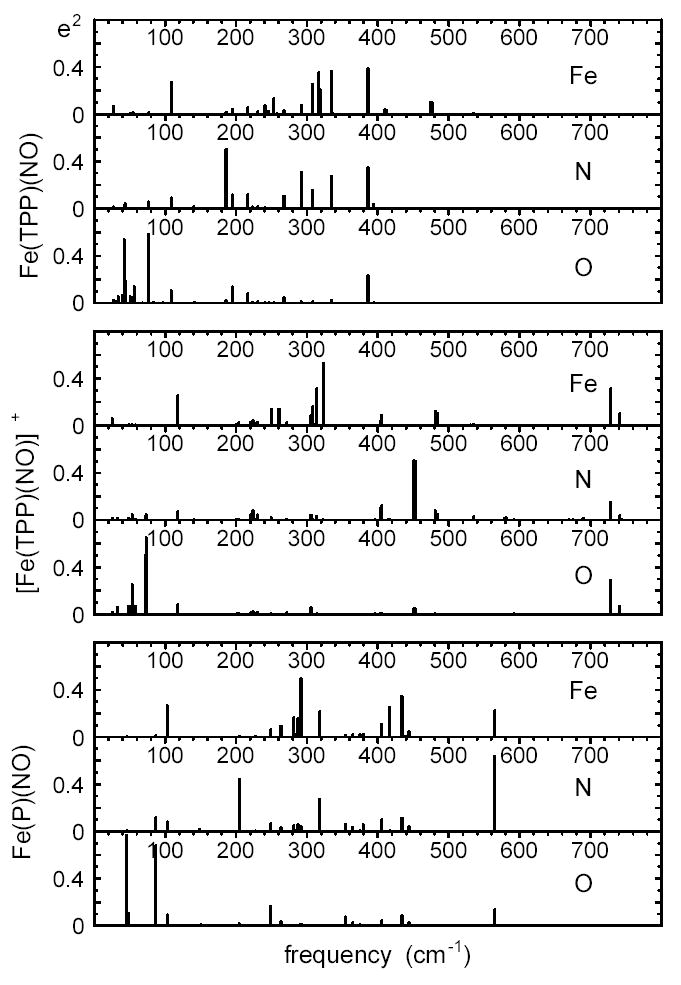
Figure 9.

Comparison of vibrational dynamics of Fe and the nitrosyl N and O atoms for Fe(TPP)(NO), [Fe(TPP)(NO)]+, and Fe(P)(NO), predicted on the basis of B3LYP calculations. The heights of the individual bars indicate the fraction of mode energy associated with each of these three atoms. These stick spectra reveal fine structure that is not apparent after convolution with a lineshape function, as in Fig. 7.
