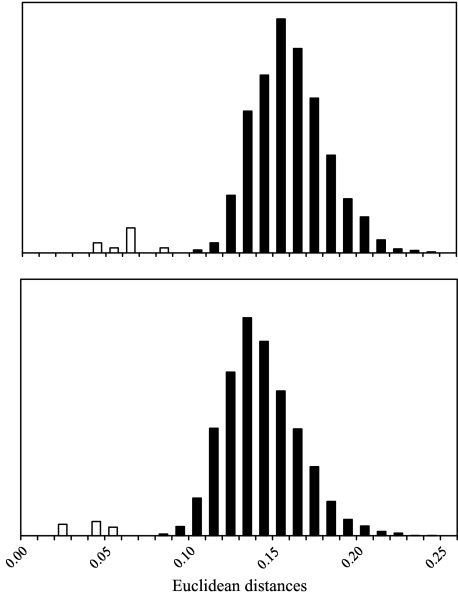
Fig. 2.
Analysis of intra-observer error. Frequency distributions of all Euclidean distances among 59 specimens of H. sapiens (top panel) and among 78 specimens of Pan troglodytes troglodytes (bottom panel) are shown in black. White columns show the distributions for Euclidean distances between repeated sets of landmarks for the same individuals. The latter are not to scale and are exaggerated to illustrate their position relative to differences between individuals.

