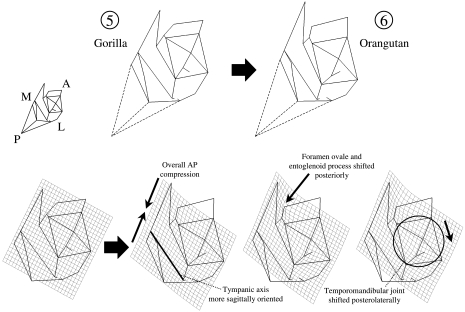
Fig. 10.
Thin-plate spline transformation between Gorilla (reference shape) and Pongo (target shape). Inferior view. Numbers correspond to those in Fig. 7 and indicate the position of the reference and target shapes in the PCA. Dashed lines indicate the position of asterion, for display purposes. That landmark is not incorporated into the analysis.

