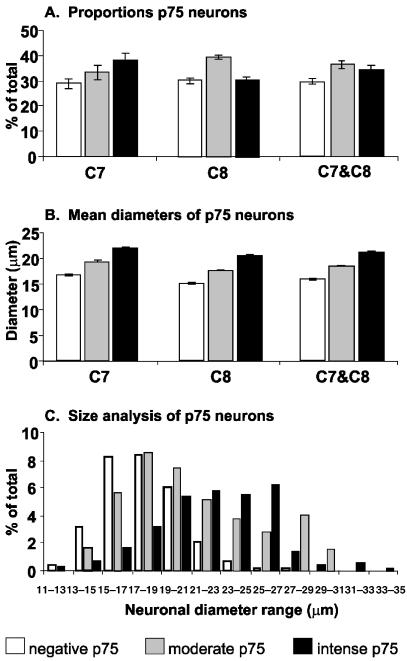
Fig. 2.
(A) Histograms illustrating the proportion of negative, moderate and intense p75NTR neuronal groups in the C7 and C8 DRG. In the C7 DRG, approximately 29% of neurones were negative, 33% were moderate and 38% were intense for p75NTR. In the C8 DRG, approximately 31% of neurones were negative, 39% moderate and 30% were intense for p75NTR. When the data for C7 and C8 are combined, one-third of the neurones are negative, another third moderate and the remaining third intense for p75NTR. (B) These histograms illustrate the mean diameter of the three groups of neurones within the C7 and C8 DRG. Significant differences (P < 0.01) were observed between the mean diameters of the three groups. There was a correlation between neuronal diameter and the expression of p75NTR. The negative p75NTR neurones were the smallest in diameter, while the intense p75NTR neurones were the largest. (C) Neuronal diameter frequency histogram of the three groups of neurones. While neurones in the intense group can be seen across all diameter ranges, they have a distinct bias towards the larger diameters with a modal value of approximately 26 µm. The moderate and negative p75NTR groups have similar modal values of approximately 18 µm. The means and standard errors were obtained from groups with four animals.

