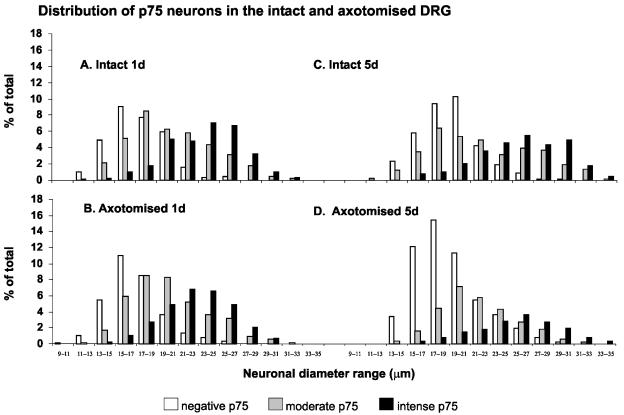
Fig. 5.
Neuronal diameter frequency analysis of negative, moderate and intense p75NTR DRG neurones in intact (top) and axotomized (bottom) DRG. At 1 day after axotomy (1d), there is no change in the frequency profiles of the three groups in the intact and axotomized DRG (compare A and B). However, at 5 days after axotomy (5d), the largest neurones expressing the highest levels of p75NTR are preferentially lost in the axotomized DRG (compare C and D). The means and standard errors were obtained from groups with four animals.

