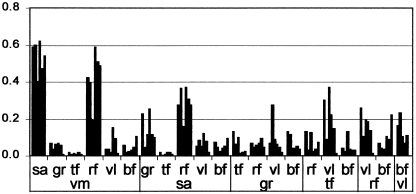
Fig. 6.
Cross-correlations (y-axis) between all possible pairs of the seven investigated muscles in six animals. Each bar represents the correlation coefficient in one animal. The figure should be read as follows: the six columns at the far left represent the correlatons (in six animals) between VM (vastus medialis) and SA (sartorius) muscles, the next group the correlations of VM with GR (gracilis), and so on.

