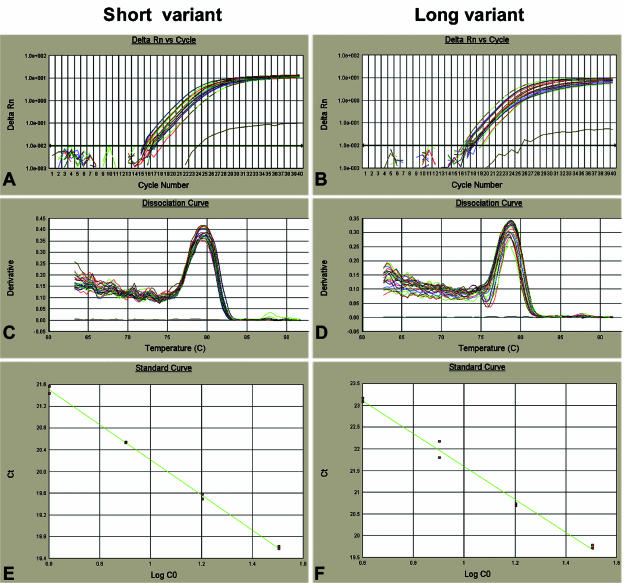
Fig. 4.
Real-time PCR amplification plot and standard curve for short and long NC3 variants. (A,B) The amplification plots of short and long variants. (C,D) The dissociation curves for the short and long variants showing that there was only one PCR product in each reaction with the right melting temperature (79 °C for the short variant, 78 °C for the long variant). (E) The standard curve for the short variant (slope =−3.336, R2 = 0.999) while (F) is for long variant (slope =−3.664, R2 = 0.995).

