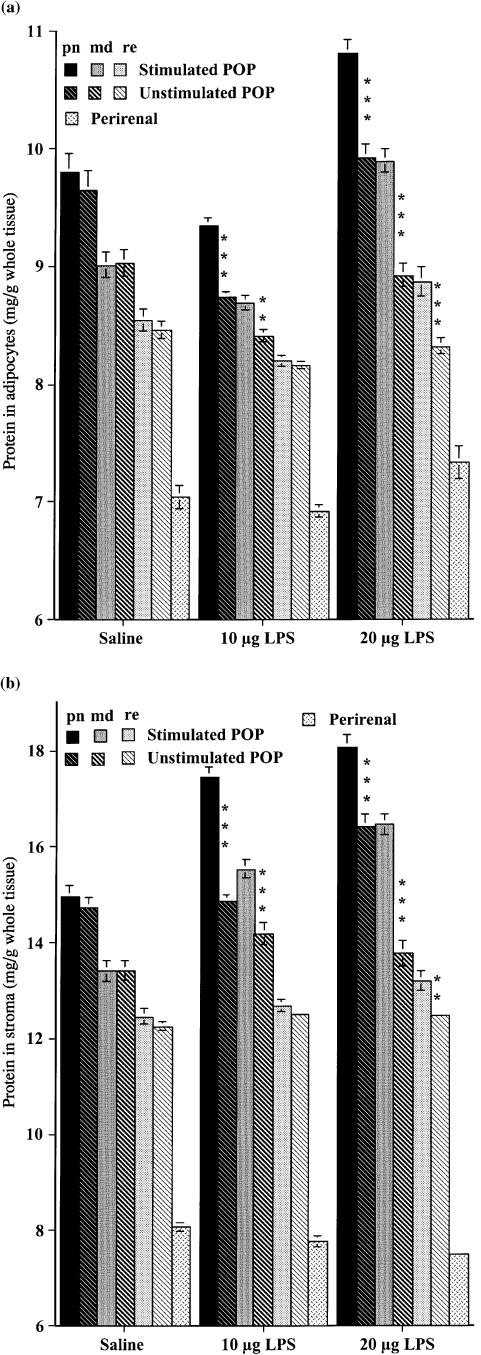
Fig. 4.
Means ± SE of protein content (mg/g fresh weight adipose tissue) of the adipocytes and stroma from the adipose tissue surrounding the stimulated and unstimulated popliteal lymph nodes, and that of perirenal adipocytes, following three injections per week for 6 weeks of 10 or 20 µg lipopolysaccharide, or saline. Bar patterns and shading as in Figs 1 and 3. (A) Isolated adipocytes; (B) stroma of adipose tissue. Each group, N = 18 large male rats. Differences between homologous samples from stimulated and unstimulated legs of the same rats significant at: *P < 0.05; **P < 0.01; ***P < 0.001.

