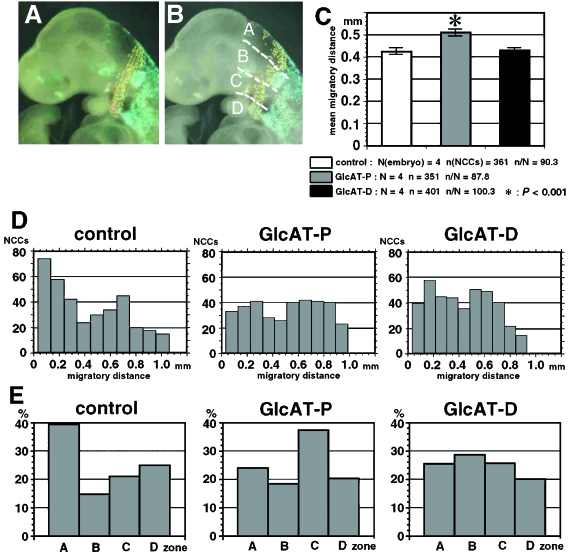
Fig. 5.
Altered migration of the second pharyngeal arch NCCs after electroporation with GlcAT genes. (A) Measurement of NCC migration. The distance of each NCC from the posterior edge of the neuroepithelium is measured in the lateral digital images (yellow lines). This distance is an approximate projection of the three-dimensional migratory course to the sagittal plane. (B) NCCs were counted in the four zones as follows: Zone A, from the neuroepithelium to the dorsal edge of the otic vesicle; Zone B, between the dorsal and ventral edges of the otic vesicle; Zone C, from the ventral edge of the otic vesicle to the base of the second pharyngeal arch; Zone D, within the second pharyngeal arch. (C) Average of the NCC migratory distance in the control group (GFP transfection only; white bars), the GlcAT-P transfection group (grey bars) and the GlcAT-D transfection group (black bars). NCCs in the GlcAT-P group migrate further than in the other groups. Asterisk: P < 0.001 by anova and Sheffe's test. (D) Distribution of NCC numbers along their migratory distance. NCCs show relatively shorter migration in the control group. Two peaks are observed at about 0.2 mm and 0.6 mm of migration in the GlcAT groups. The 0.2-mm peak is higher in the GlcAT-D group. (E) Percentages of NCCs in the four zones. Numbers are high in Zone A in the control group, in Zone C in the GlcAT-P group and in Zone B in the GlcAT-D group.

