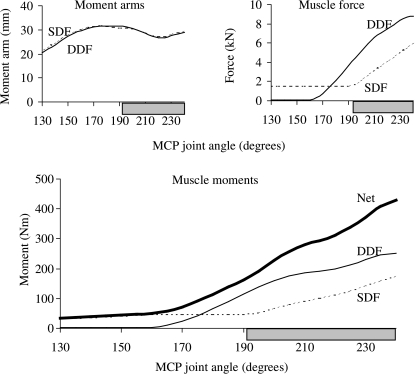
Fig. 2.
Joint moments, moment arms and forces calculated for the muscles that flex the MCP joint in the model. Peak net flexor moment occurred when the MCP joint was moved to 240° and coincided with peak muscle force (upper panel). Muscle force dominated the pattern of the joint moment–angle curves for the flexor muscles. The horizontal shaded bar indicates the joint angles associated with the stance phase of walking and trotting (van Weeren et al. 1993; Hodson et al. 2000).

