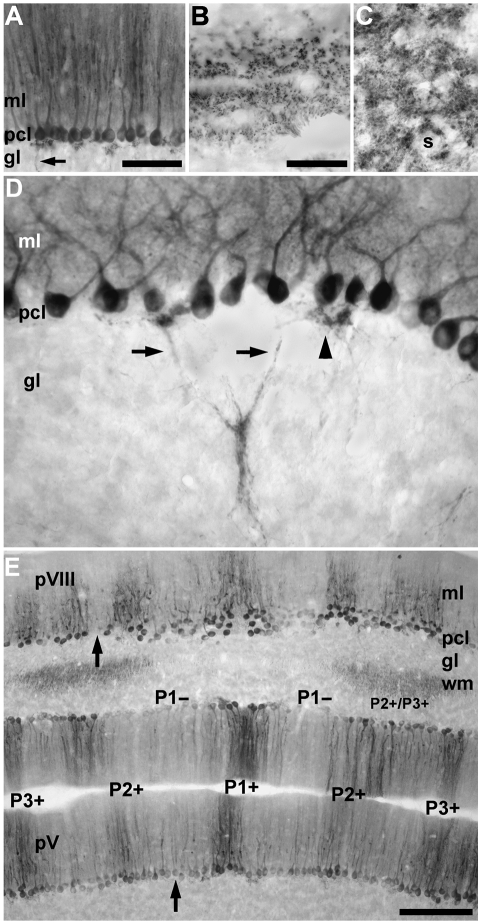
Fig. 2.
Zebrin II expression by Purkinje cells in the tenrec cerebellum as viewed in immunoperoxidase-stained horizontal sections. (A) The expression of zebrin II in the vermis of lobule IV–V. All Purkinje cells are immunoreactive in this field. No other cells in the cerebellar cortex are stained. Reaction product is deposited heavily in the dendrites in the molecular layer (ml) and the somata in the Purkinje cell layer (pcl). Purkinje cell axons in the granular layer (gl) are also immunoreactive (arrow). (B) Zebrin II immunoreactivity in the cut profiles of Purkinje cell axons located in the white matter is seen as tracts. (C) Staining in the cerebellar and vestibular nuclei is as punctate deposits around the somata of neurons (s), consistent with the distribution of Purkinje cell axon terminals. (D) Zebrin II immunoreactivity is detected in the cytoplasm of the Purkinje cell somata but not the nuclei. Immunoreactive Purkinje cell axons (arrows) exit the somata and converge in the granular layer forming small fascicles. Occasionally, axons and recurrent axon collaterals form a dense plexus directly beneath the Purkinje cell layer (arrowhead). (E) Low-power view of the vermis of presumptive lobules V (pV) and VIII (pVIII). Zebrin II expression is restricted to a Purkinje cell subset that forms a symmetrical array of stripes. Stripes of non-reactive Purkinje cells (e.g. arrow in lobule pVIII) interrupt immunoreactive Purkinje cell stripes. The P1+ (midline) and two laterally located P2+ and P3+ stripes are labelled. Note that in the ‘negative’ stripes (e.g. P1−) the Purkinje cell somata may be weakly reactive for zebrin II (e.g. arrow in lobule pV) and the distinction between stripes depends largely on the dendritic immunoreactivity in the molecular layer. In the white matter (wm), the axons of zebrin II-immunoreactive Purkinje cells form symmetrically organized fascicles on either side of the midline (for the same in rat, see De Camilli et al. 1984; see also Voogd, 1969). Scale bar = 100 µm in A; 50 µm in B (also applies to C and D); 250 µm in E.

