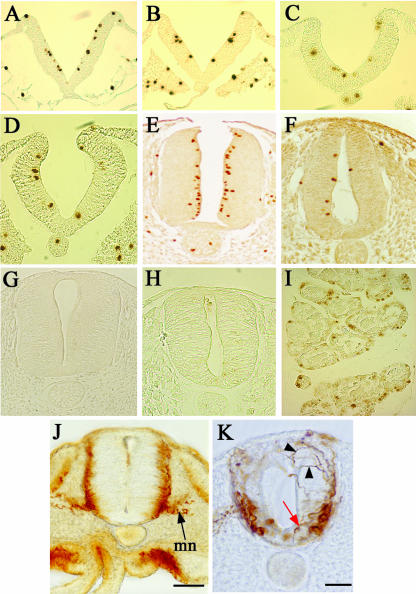
Fig. 4.
Cell proliferation (A–F) and apoptosis (G,H) in the normal and RA-free quail embryo spinal cord. Cell proliferation is assessed by an anti-phosphohistone H3 antibody, which marks the nuclei brown. (A,B) Sections of a stage 8 normal (A) and RA-free (B) embryo at the presumptive anterior spinal cord level. Equivalent levels of proliferation are apparent. (C,D) Sections of a stage 10 normal (C) and RA-free (D) embryo at the presumptive anterior spinal cord level. Equivalent levels of proliferation are apparent. (E,F) Sections of a stage 18 normal (E) and RA-free (F) embryo at the level of the forelimb. In E the proliferating cells are concentrated at the ventricular surface, but in F the numbers of proliferating cells are vastly reduced. (G,H) Absence of any apoptotic cells in a normal (G) and RA-free (H) stage 18 spinal cord at the forelimb level as assessed by TUNEL staining. (I) Control section of developing rat mammary gland run at the same time as G and H to show that apoptotic cells can readily be detected by this method when they are present. (J,K) Sections of wholemount neurofilament stained stage 18 embryos. The normal embryo (J) shows strong staining in the mantle zone and in the motor neurons (mn). The RA-free embryo (K) shows a decrease in staining with no real mantle zone, fewer motor neurons and completely chaotic axonal projections. Some motor neurons seem to be displaced into the floor plate with axons growing towards the lumen rather than out into the periphery (red arrow) and other axons wander dorsally (black arrowheads).

