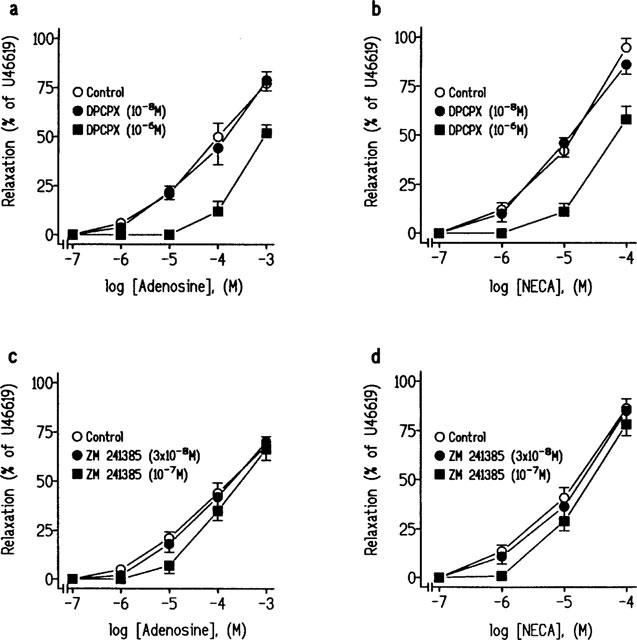
Figure 5.

Log concentration-response relaxation curves to (a and c) adenosine and (b and d) 5′-N-ethylcarboxamidoadenosine (NECA) in pig intravesical ureteral strips contracted to 10−7 M U46619, in control conditions and in the presence of the A1-adenosine receptors inhibitor, 3-dipropyl-8-cyclopentylxanthine (DPCPX), (10−8 M) or (10−6 M) (a and b) and the A2A selective receptors antagonist, 4-(2-[7-amino-2-(2-furyl) [1,2,4]-triazolo[2,3-a][1,3,5]triazin-5-ylamino]ethyl)phenol (ZM 241385), (3×10⁻⁸ M) or (10−7 M) (c and d). The relaxations are expressed as a percentage of the U46619-induced contraction. Results represent means and vertical line s.e.mean of 6–9 preparations.
