
Figure 6.
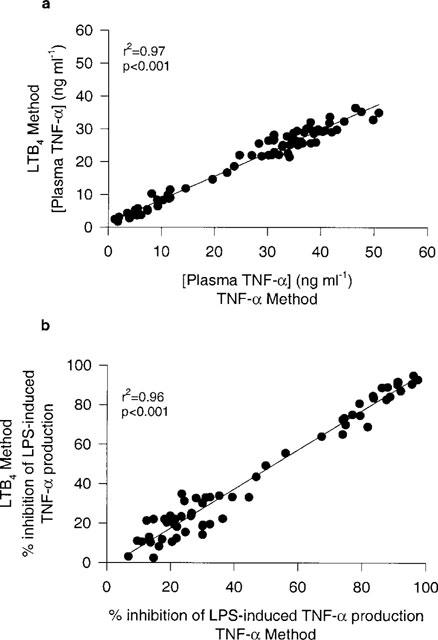
Linear correlation of results obtained from two methods of LPS-induced TNF-α in human whole blood. TNF-α Method: whole blood samples incubated with LPS (1 μg ml−1) for 24 h. LTB4 Method D: whole blood samples incubated with LPS (1 μg ml−1) for 24 h followed by 30 min incubation of LPS (1 μg ml−1) then a 15 min incubation with fMLP (1 μM). (a) represents plasma TNF-α levels from an experiment where both methods were done in the same blood sample in the presence and absence of varying concentrations of 10 different PDE4 inhibitors. n=71 data points. (b) represents the percentage inhibition of TNF-α of the same data points (except data points from positive no drug controls from which the percentage inhibition was calculated). n=61 data points. All data represented were blood samples from one donor.