
Figure 7.
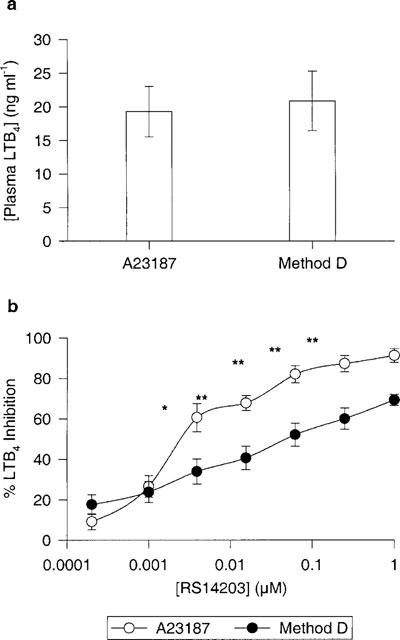
Comparison between two methods of LTB4 human whole blood assays. (a) represents plasma LTB4 levels for both assays and (b) represents the titration curve for RS14203 in both assays. A23187 method: whole blood challenged with 25 μM A23187 for 30 min. Method D: whole blood pre-stimulated with LPS (1 μg ml−1) for 24 h followed by 30 min stimulation with LPS (1 μg ml−1) then a 15 min incubation with fMLP (1 μM). n=3 donors. Both methods were performed in the same donor sample. *P<0.05 and **P<0.01.