
Figure 7.
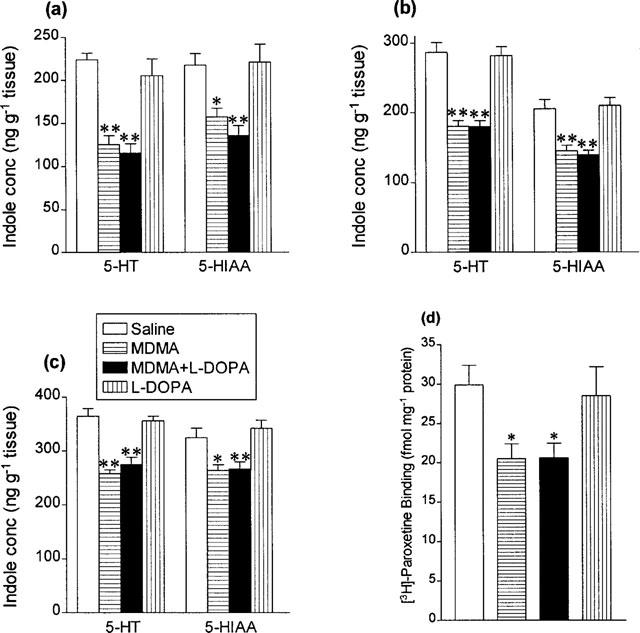
Indole concentrations in (a) hippocampus, (b) cortex and (c) striatum and (d) density of 3H-paroxetine labelled 5-HT uptake sites in cortex 7 days following saline or L-DOPA (25 mg kg−1 i.p.+benserazide 6.25 mg kg−1 i.p.) 2 h after saline or MDMA (15 mg kg−1 i.p.). Results shown as means±s.e. mean, n=5–8. Different from saline-treated: *P<0.05, **P<0.01.