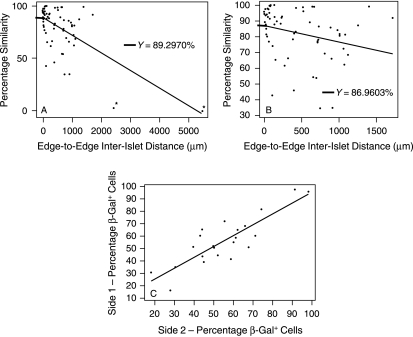
Fig. 9.
Analysis of cell composition of dumb-bell and non-dumb-bell islets. (A,B) Relationship between percentage β-gal+ cells and edge-to-edge distance in random pairs of non-dumb-bell islets. (A) Including outliers (asterisks) (n = 65 pairs). (B) Outliers excluded (n = 63 pairs). (C) Relationship between percentages of β-gal+ cells on the two sides of each of 23 dumb-bell islets.

