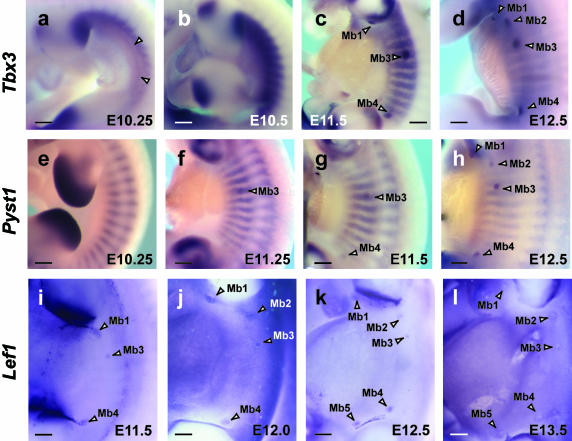
Fig. 1.
Expression of Tbx3, Pyst1 and Lef1 from E10.25 to E13.5. (a) Tbx3 expressed in a thin line marking what appears to be the mammary line (between two arrowheads). Tbx3 is also expressed in a graded fashion in a thicker band more dorsally with transcripts being more abundant anteriorly. (b) Tbx3 expression at E10.5 is stronger than E10.25 but the line seen at E10.25 cannot be distinguished. (c) E11.5; three pairs of mammary buds expressing Tbx3 become apparent in a dot-like pattern (Mb1, Mb3 and Mb4). (d) E12.5; five pairs of mammary buds expressing Tbx3. (e) E10.25; Pyst1 expressed as stripes marking the somites, and not yet in mammary rudiments. (f) Pyst1 expression first detected in a mammary rudiment (Mb3); at E11.25 it is also in stripes of somitic expression. (g) Pyst1 expression in Mb3 and Mb4 at E11.5. (h) Pyst1 expressed in full complement of mammary buds at E12.5 (Mb1–Mb5). (i) E11.5; Lef1, known as early marker of mammary placode formation, expressed in Mb3 in a dot-like pattern; in Mb1 and Mb4 in a comet-like pattern with a tail. (j) Lef1 expressed separately in Mb2 and Mb1 at E12. (k–l) E12.5 and E13.5; Lef1 expression detected in five pairs of mammary buds. Note that Mb5 is last to form. Mb1–5, mammary buds. Scale bars, 200 µm.

