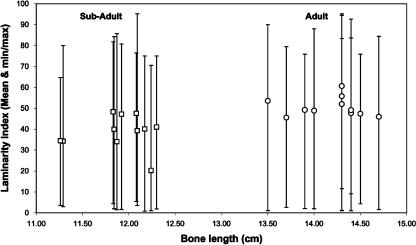
Fig. 9.
Scatter plot of bone length vs. laminarity index. Squares indicate subadult bones; circles indicate adult bones. Each symbol indicates one bone, and the vertical bars associated with each data point indicate the minimum/maximum range of the laminarity indices of the octants of the bone. The P value of this subadult (n = 88 data points) vs. adult (n = 88 data points) comparison is < 0.001.

