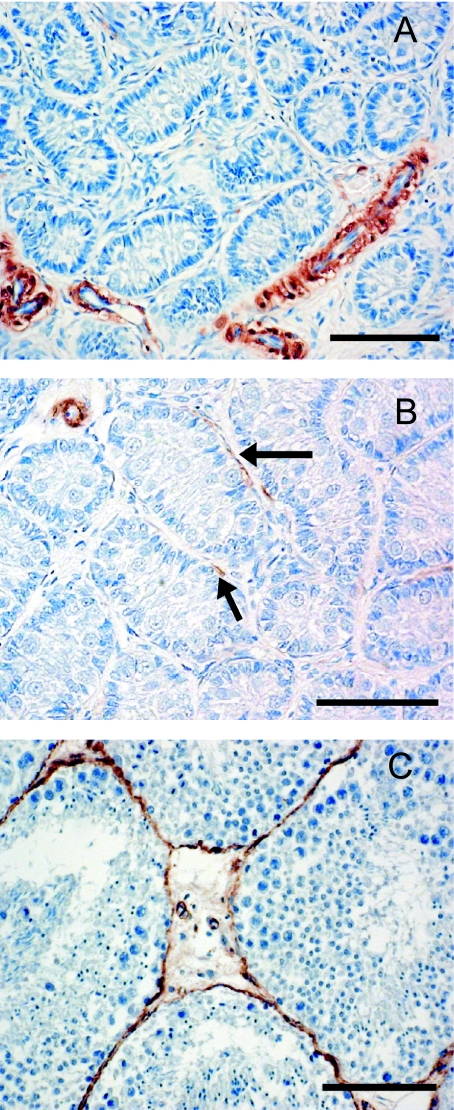
Fig. 1.
Photomicrographs A, B and C illustrate the three types of testicular SMA distribution used as a basis for classification in this paper; in (A) no peritubular SMA is present, in (B) some sparse peritubular SMA is apparent (arrows) while in (C) SMA-positive peritubular myoid cells surround the seminiferous tubules (scale bar = 100 µm).

