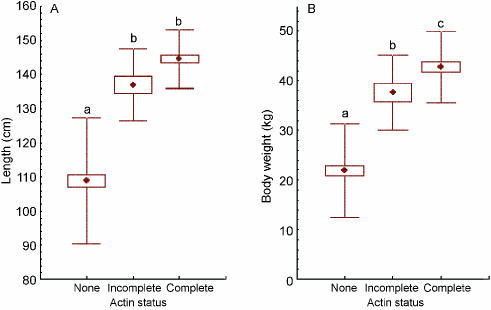
Fig. 3.
Box-whisker plots showing differences in body length (A) and body weight (B) between 95 porpoises classified according to the ‘actin status’ (• represents the mean; box represents standard error of the mean and whisker represents standard deviation). Lower-case letters above the whiskers indicate significant differences (P < 0.01) between groups.

