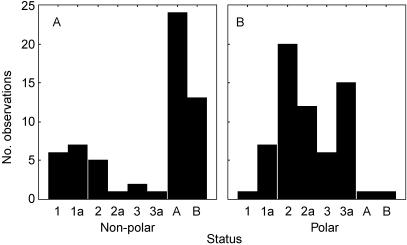
Fig. 5.
Categorized histogram showing the frequency distribution of 122 individual animals classified by ‘status’ (i.e. histological assessment) and as having (A)non-polarized (n = 59) and (B)polarized (n = 63) vimentin distribution within their spermatogonia and prespermatogonia. Significant differences (χ2 = 67.5; P < 0.0001) between panels A and B are most apparent in status categories 2–3a and (mature) A and B.

