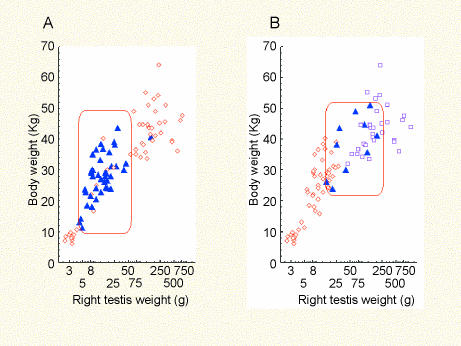
Fig. 6.
Scatterplots showing relationships between right testis weight and body weight. In panel A the points represent 131 individuals showing polarized (▴) and uniform (◊) vimentin in prespermatogonia and spermatogonia. In panel B the points represent 153 individuals distinguished according to the ‘actin status’ (◊ = no actin; ▴ = incomplete actin; □ = complete peritubular actin). Rectangles indicate approximate testis and body weight ranges corresponding to testes in which (A)prespermatogonia are colonizing the basal compartment of the seminiferous tubules and (B)the blood–testis barrier is undergoing development.

