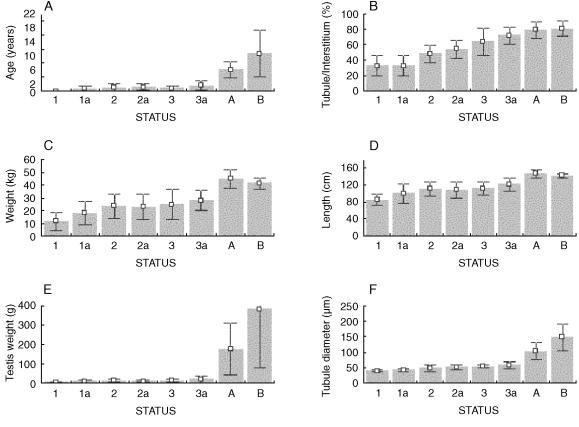
Fig. 7.
Panels A–F show a series of bar graphs showing mean (± SD) somatic and reproductive characteristics of porpoises classified according to the histological definition of ‘status’. A, age (n = 80); B, tubule–interstitial tissue ratio (%) (n = 123); C, body weight (n = 128); D, body length (n = 128); E, right testis weight (n = 113); F, tubule diameter (n = 125).

