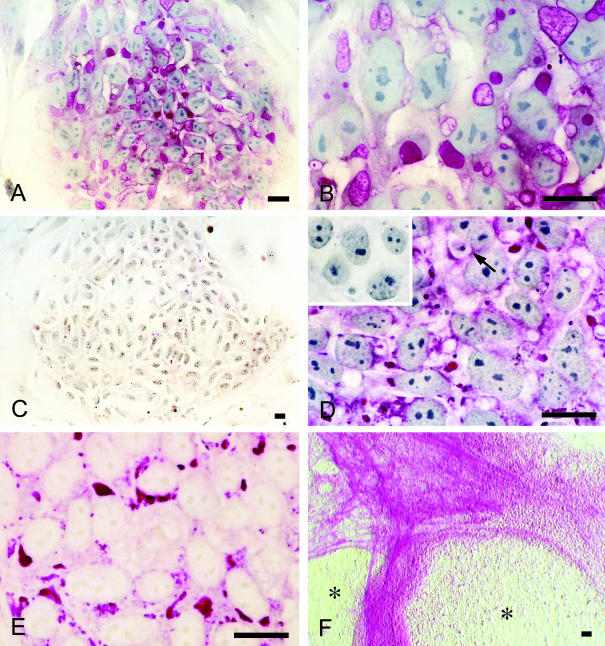
Fig. 2.
PAS staining of human ES cell colonies. (A) The same initial-stage colony as in Fig. 1(A). Granules with various intensities for PAS staining are clearly visible throughout the colony. (B) The same area as in Fig. 1(B). Granules and deposits seen in Fig. 1(B) show different intensities for PAS staining. (C) PAS staining of an initial-stage colony after amylase digestion. Note the significant reduction of reactivity. (D) The same area as in Fig. 1(D). Most of the dark deposits seen in Fig. 1(D) show strong intensity for PAS staining. Arrow: coarse particle with a halo. Inset: amylase digestion eliminated the reactivity. (E) Undifferentiated area of a colony with peripheral differentiation. Nuclear counterstaining was omitted. PAS-positive glycogen areas can be clearly seen in the cytoplasm. (F) Amylase digestion of the colonies with peripheral differentiation. PAS-positive fibrous structures not digested by amylase are evident in the circumference of the amylase-sensitive undifferentiated areas (*). Hoffman modulation contrast image without nuclear counterstaining. Bars = 20 µm.

