Fig. 3.
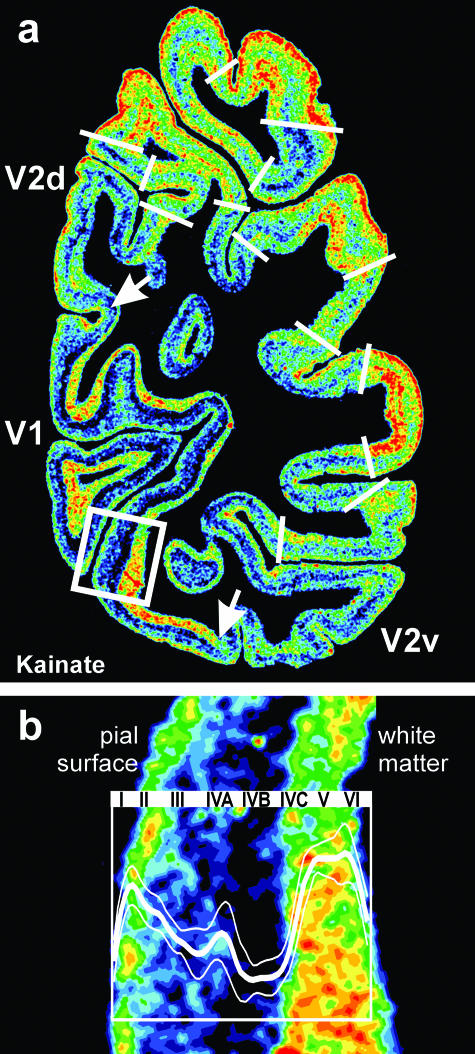
(a) Regional and laminar distribution patterns of the glutamatergic kainate receptor in a coronal section through the human occipital cortex. The white arrows indicate the dorsal and ventral borders between V1 and V2. For colour coding see legend to Fig. 1. V1 differs from V2 by a lower kainate receptor density in the granular and supragranular layers (layers I–IVC), and by a higher kainate receptor density in the infragranular layers (layers V–VI). Further regional and laminar variations of kainate receptor densities are visible in this section. These local variations of the kainate receptor expression indicate additional borders (white lines) of hitherto unidentified cortical areas (cf. Fig. 4). The position of (b) is indicated by the rectangle in (a). (b) Detailed laminar distribution of the kainate receptor in V1. The profile curve within the inset (bold white line) represents measurements of the kainate receptor densities in V1 from the pial surface to the cortex/white matter border. Dotted lines indicate the standard deviation (cf. Fig. 1). The Roman numerals indicate the position of the cytoarchitectonically defined (by comparison with adjacent cell body-stained sections) cortical layers.

