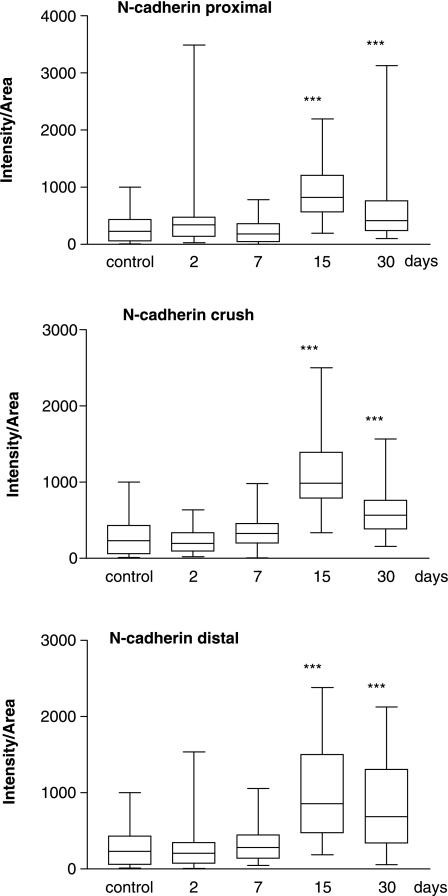
Fig. 6.
Box and whisker plot showing quantification (median value and 25–75 percentile range) of N-cadherin expression, proximal (top) and distal (bottom) to the crushed site and also within the crushed area (middle) at different time points after injury. ***P < 0.001 when median values are compared with control nerve using Dunn's multiple comparisons test.

