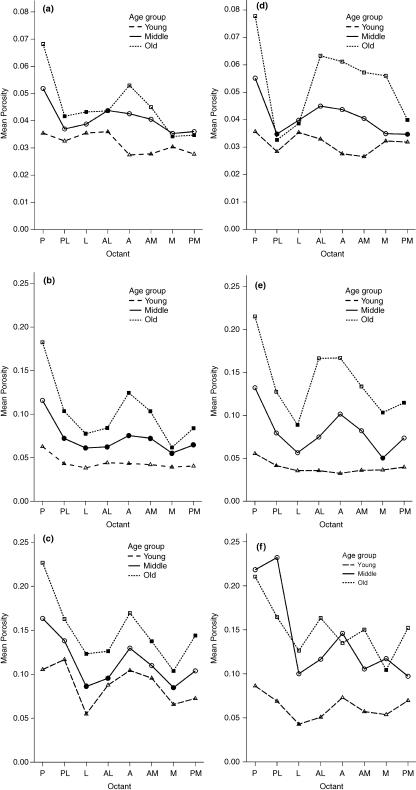
Fig. 2.
Porosity distribution around the cortex, with specimens grouped by age: (a–c) males, (d–f) females. The upper pair is for the periosteal ring (note different vertical scales), the middle pair for the midcortical and the lower pair for the endosteal ring. Solid symbols indicate significant difference at P = 0.05 from the posterior octant within each group.

