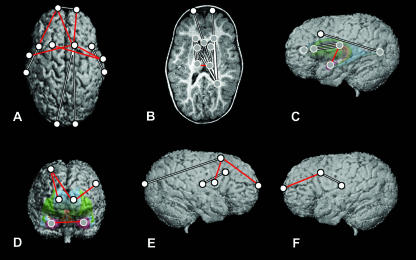
Fig. 7.
Comparisons of postoperative ISS and preoperative ISS samples at Age B, shown on a preoperative ISS patient. The top row represents a superior view of the cortical surface (A), a transverse slice displaying subcortical structures (B) and the left lateral view of the 3D surface with a model of subcortical structures ghosted beneath (C). The bottom row represents a midsagittal slice (D), a right lateral view of the 3D reconstruction of the cortical surface (E) and a left lateral view of the 3D reconstruction of the cortical surface (F). White dots represent landmarks located on the cortical surface, and grey dots represent landmarks located on subcortical structures. Red lines indicate linear distances that are significantly greater in the postoperative sample; white lines indicate those that are significantly smaller in the postoperative sample.

