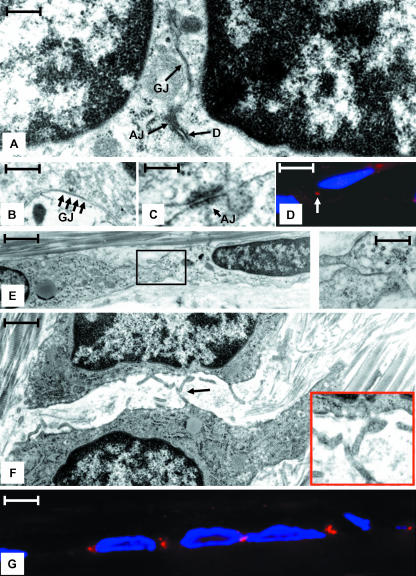
Fig. 2.
(A) TEM micrograph illustrating two adjacent cells connected by a gap junction (GJ), an adherens junction (AJ), and a desmosome (D) in a region were two cells and their nuclei are in close appositions. Scale bar = 50 nm. (B) High-magnification image of a region similar to that shown in A demonstrating an extensive gap junction (GJ, arrows). Scale bar = 25 nm. (C) High-magnification region of a region similar to that shown in A illustrating an adherens junction (AJ). Scale bar = 30 nm. (D) Indirect immunofluorescent image of cells reacted with DSI II, a desomosome marker (red), as well as DAPI to denote nuclei (blue). Note the prominent reactivity in the region between cells (arrow) at the site of desmosomes detected by TEM. Scale bar = 8 nm. (E) Two adjacent cells connected by a gap junction (boxed regions and shown in inset) in a region where the nuclei are far apart. Scale bar = 1.5 nm, inset = 10 nm. (F) Adjacent cells in a region lateral to a region shown in A where the surfaces of the cells are not in close apposition. Note the numerous short cytoplasmic projections. These projections often come in close apposition (arrow). Scale bar = 2 µm. (G) Immunoflourescence image showing the pattern of Cx43 staining (red) in vivo. The staining pattern corresponds to the placement of gap junctions seen by TEM. Nuclei are stained with DAPI (blue). Scale bar = 10 µm.

