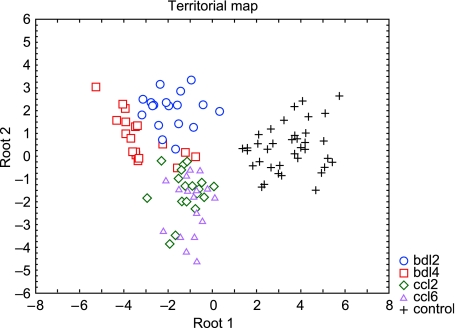
Fig. 5.
Territorial map based on discriminant analysis showing distances between the centroids representing the compared groups. Centroids are the points in multiparameter space, in our case defined by five parameters (values of energy, entropy and area radial distribution; Fast fourier transformation; and fractal dimensions). The numerical Mahalanobis distances shown in the attached table emphasize the distinct differences between the analysed groups.

