Fig. 7.
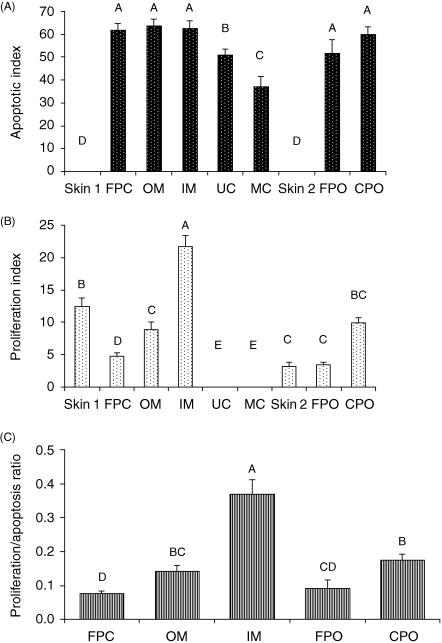
Apoptotic and proliferation indexes for different tissues in the antler tip. Values were determined by counting cells in ten fields from three different deer and are expressed as a percentage of the total number of cells. Bars represent the mean ± SEM. The fields included: skin 1 (overlying the perichondrium), fibrous perichondrium (FPC), outer mesenchyme (OM), inner mesenchyme (IM), unmineralized cartilage (UC), mineralized cartilage (MC), skin 2 (overlying the periosteum), fibrous periosteum (FPO) and cellular periosteum (CPO). The apoptotic index (A) was highest in FPC, OM, IM, FPO and CPO. The proliferation index (B) was highest in the inner mesenchyme. Bars with different letters represent statistical differences between regions (P < 0.01). (C) Ratio of proliferation to apoptosis for different tissues in the antler tip. Bars with different letters represent statistical differences between regions at P < 0.01. Values are not shown for skin, UC or MC because the value for either the apoptotic index or the proliferation index was zero.

