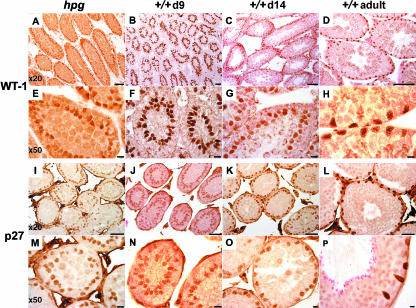
Fig. 2.
Expression of WT-1 (upper panels) and p27 (lower panels) immunoreactivity in adult hpg mouse testis (far left column: hpg) or wild-type mouse testes on postnatal day 9 (second left column: +/+d9), day 14 (second to right column: +/+d14) or adult (far right column: +/+adult). For each antigen, the upper row are micrographs obtained with a × 20 objective (scale bars = 30 µm), the lower row obtained with a × 50 objective (scale bars = 10 µm).

